User Interface#


Docks#
GTlab uses the dock widgets concept to organize its interface. Dock widgets are secondary windows that can be arranged around the central GTlab workspace.
Managing Dock Widgets#
Dock widgets can be:
Moved within their current area
Repositioned into a new dock area
Detached (floating) anywhere on the screen
Each dock widget consists of:
A title bar
A content area
You can reposition or undock a widget by dragging its title bar to a new location. To close a widget, click the X button on its title bar.
Project Explorer#
This dock widget shows the project structure of the current session. There can be several projects, of which a maximum of one can be open. The entire hierarchical model structure of the open project is visualized in a tree structure.
Property Dock#
The corresponding properties are displayed in this dock widget for a selected object in the GTlab model (e.g. an object of the model in the Project Explorer or a work flow element). Depending on the object, the properties can also be displayed in several tabs in this window.
Output Dock#
The Output widget primarily holds two tabs. The Application tab shows the logging output in GTlab. More on this in the Logging section. The Python Console tab allows you to interact with the Python instance to receive messages from the Python interaction with GTlab as well as to use Python commands in GTlab. More on this in the section Python Console.
Process/Calculators#
The Process/Calculators widget is for the coordination of workflows (of the hub-spoke architecture).
Instructions for creating and starting new workflows can be found here.
Workflows are grouped user-specifically in GTlab. The workflow grouping currently displayed can be changed using the drop-down menu at the top of the window.
Editor Area#
The Editor Area is GTlab’s main working space and displays all open editors.
Managing Editors#
In the default mode, you can switch between open editors using tabs. Many editors also provide a printing function, accessible from their toolbar.
Available Editors#
Depending on the installed modules and selected objects, GTlab offers different types of editors and viewers, for example:
A graph-based workflow editor (from the GTlab IntelliGraph Module)
An editor for modeling aircraft engine performance
A 2D sketching editor
A 3D geometry viewer
An editor for displaying tabular data
…
Logging#
GTlab uses a logging system which is displayed in the Output window. In the Application tab, all logging messages that are issued in the system are collected, both from the main application and from modules.
Each message is displayed with its category and information on the ID and time. The ID indicates which part of the programme sent the message.
The possible categories are explained below; not all of them are relevant for users of the software, but some are aimed at developers.
Category |
Icon |
Description |
|---|---|---|
Trace |
|
Only for developers: Hint for code development |
Debug |
|
Only for developers: Hint for code development |
Info |
|
General information about the process, useful for understanding the system’s normal operation. |
Warning |
|
Indicates potential issues or situations that might lead to problems if not addressed. |
Error |
|
Indicates critical errors that need attention of the user and may impact or interrupt the workflow’s functionality. |
Fatal |
|
Unrecoverable errors that lead to the termination of the application. |


The categories can be filtered. To do this, select or deselect the buttons in the bottom right-hand corner. A general preselection can be made via the drop-down menu in the top right-hand corner. It also modifies the generally displayed logging level. In Default mode, for example, the logging messages relevant only for developer relevant logging messages of the categories Trace and Debug are not displayed.
Further buttons in the bottom right-hand corner allow you to remove all output or export it to an external text file.
Individual messages can be filtered using the search window in the lower part of the window.
Toolbars#
GTlabs toolbar uses a adaptive design to offer buttons depending on possible option based on the shown windows done actions.
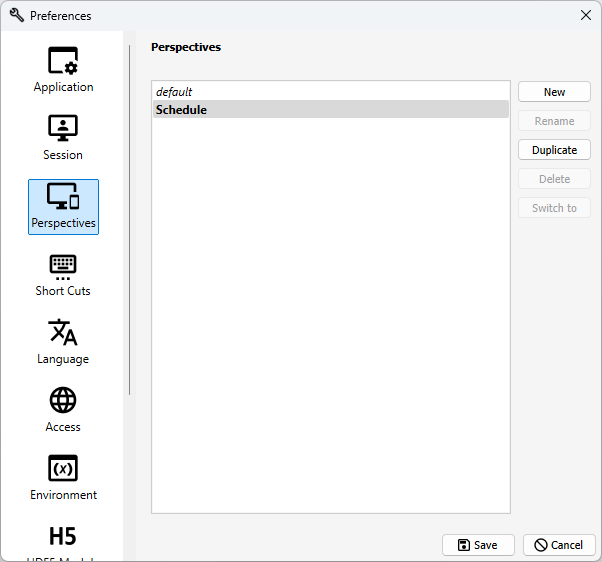
Perspectives#
The dock-widget concepts allow to customize which and where the dock widgets are positioned.
Depending of the current work of the user, different dock widgets are required, others aren’t.
Perspectives allow to save the layout of the widgets and provide an easy way to switch between different perspectives.
Creating a perspective#
To create a new perspective in GTlab:
Open the perspective settings via
Window → Edit PerspectivesClick New to create a perspective
(Optional) Rename the perspective
Press Save to confirm
Toggling perspectives#
By default, you can toggle between perspectives by pressing ALT+P. This shortcut can be customized in the Shortcut Settings page.
To switch directly to a specific perspective:
Window → Show Perspective
and choose the desired perspective from the list.